One of the most-cited researchers on the city of Chicago is Robert Sampson, a longtime University of Chicago sociologist now at Harvard; his big, career-defining work is Great American City, a vast, complex analysis of Chicago. Though he's been out of the city for awhile, he's still studying it, most recently through the lens of Google: measuring gentrification via the all-seeing eye of Street View, and trying to figure out where and why it's happening.
NPR's Gene Denby has an introduction to the study, co-authored with doctoral student Jackelyn Hwang:
The researchers started with earlier data showing neighborhoods that appeared to be undergoing gentrification. But when they looked at those same areas more recently, they found that in areas where the population was 40 percent black, that gentrification seemed to grind to a halt.
On the other hand, neighborhoods that began in 1995 with a population of at least 35 percent white continued to gentrify: suggesting a "threshold," to use Hwang and Sampson's term, at which gentrifiers are willing to move into a neighborhood.
But reading the study (h/t Elly Fishman), it's a bit more complex, particularly when it comes to Latinos:
Counter to prior evidence that residential preferences favor Latinos over blacks as neighbors, the Hispanic estimate was far more negative than the black effect in neighborhoods that were less than about 40 percent black.
Here's what the numbers look like:
Estimates indicate that a neighborhood with 10 percent more Hispanics than another has a lower gentrification stage score by .31 standard deviations at all levels of Hispanic composition…. The association of race with GGO stage scores, however, is considerably greater in neighborhoods with relatively more blacks. For example, a neighborhood that is 15 percent black has a stage score .14 standard deviations lower than one that is five percent black, but a 45 percent black neighborhood has a stage score .27 deviations lower than one that is 35 percent black—nearly double the effect.
[snip]
The partial residual plot for tracts' share of Hispanics predicting GGO stage scores reveals a steep initial decline that becomes relatively flat as the number of tracts with relatively large shares of Hispanics decreases substantially.
OK, so that's pretty interesting. The conventional wisdom is that gentrifiers are more willing to gentrify heavily Hispanic neighborhoods than heavily black neighborhoods. Hwang and Sampson are suggesting that that's not necessarily so. The difference between a neighborhood that has a small black population and one that has a significant but not large population—from five percent to 15 percent—is significant in terms of its likelihood of gentrification, but not enormously so. That ten percent difference in Hispanic population, however, is much more significant.
If that's the case, why are neighborhoods with large Hispanic populations often those facing gentrification?
One reason might be this: Sampson and Hwang find that neighborhoods that are at least 40 percent black are unlikely to gentrify. And in Chicago, there are a lot of those. Here's a distribution of Chicago community areas based on percentage black and Hispanic.
There are a lot of community areas (out of 77) in Chicago with less than 10 percent blacks or Hispanics. Makes sense; Chicago is very segregated. But there are twenty-one community areas with a black population of 90-100 percent. And no community areas with that percentage of Hispanics, who are simply are more evenly distributed.
At the Census tract level, it's the same; check out these maps of homogeneity and dissimilarity indicies by race in Chicago. Both are measures of the intensity of segregation; Hispanic neighborhoods aren't as intensely segregated in Chicago.
Another way of looking at it: what is the composition of neighborhoods that are likely to gentrify? Hwang and Sampson put the threshold at 35 percent white. Let's lower that to 25 percent, and make a list of community areas that are between 25 and 50 percent white: "gentrifiable," so to speak.
Two are quite diverse, Rogers Park and West Ridge.
| Whte | Black | Latino | Asian | |
|---|---|---|---|---|
| Rogers Park | 38% | 26% | 26% | 6% |
| West Ridge | 47% | 10% | 19% | 21% |
(West Ridge is the only community area with at least 10% representation of the basic Census categories for race across the board.)
One has a black plurality, one a black majority, and one a substantial black population:
| Whte | Black | Latino | Asian | |
|---|---|---|---|---|
| Near West Side | 38% | 40% | 7% | 12% |
| Morgan Park | 37% | 55% | 5% | 1% |
| Hyde Park | 48% | 33% | 5% | 11% |
Then there are nine neighborhoods with a Hispanic majority, plurality, or substantial minority.
And this is what's really interesting about their study in the context of Chicago. If the concept of the threshold is applicable—that neighborhoods with a substantial white minority are those which are likely to gentrify—perhaps it's not that the presence of Hispanics specifically makes a neighborhood more appealing to gentrifiers. Maybe it's that, because whites and Hispanics are less segregated from each other than whites and blacks, Hispanic neighborhoods are more likely to exhibit the conditions that invite gentrification.
I was curious to see how this played out in my backyard. I live on the border of Humboldt Park, "America's hottest neighborhood," near the California corridor that's about to be transformed by restaurateur Brendan Sodikoff. It's frequently discussed as the next neighborhood to gentrify, following neighboring Logan Square. Humboldt is seemingly where Logan Square was a decade ago, in terms of the dialogue about gentrification.
So I went back and looked at tract-level data for the "threshold" of 35 percent white described by Hwang and Sampson. And it turns out that Logan Square has had a larger white population than Humboldt, going back 40-plus years. Not by much, but hovering around that threshold number.
In 1960, the areas around both Logan Square and Humboldt Park were almost all white. By 1970, the near Northwest side was in flux, but Logan Square remained almost all white, while Humboldt Park was below the 90th percentile. (Data via MapUSA.)
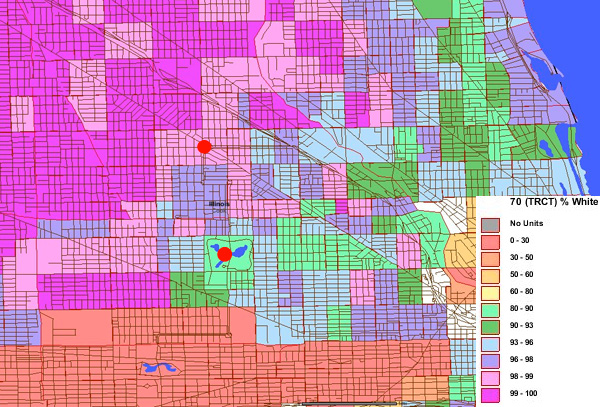
By 1980, a wide swath surrounding Humbolt Park was below 30 percent white. Around Logan Square, however, the neighborhood remained in the 30-50 percent range, around the threshold.
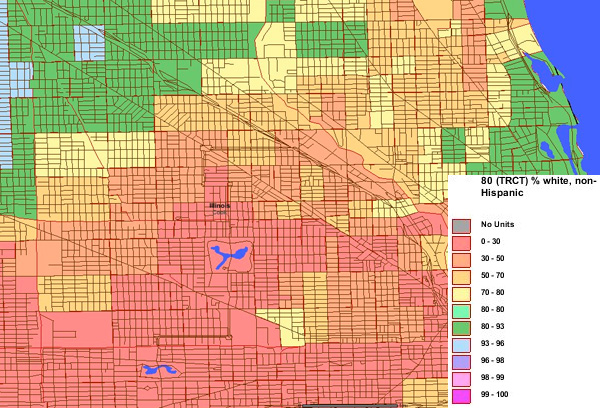
By 1990, the percentage of white residents around Logan Square declined further still, but remained around the 35 percent threshold.
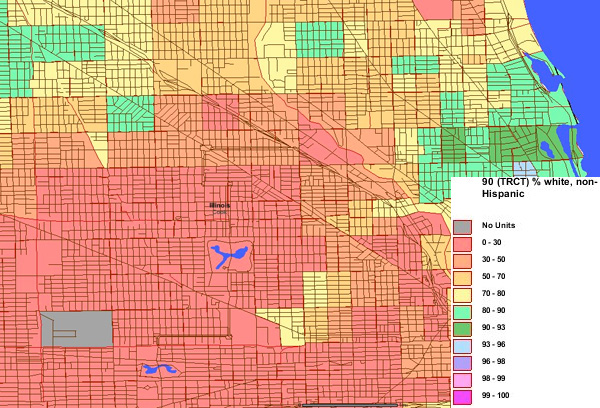
Results from the 2000 Census show that the tracts on the western border of the square itself have fallen below 30 percent white. But not east of the square.
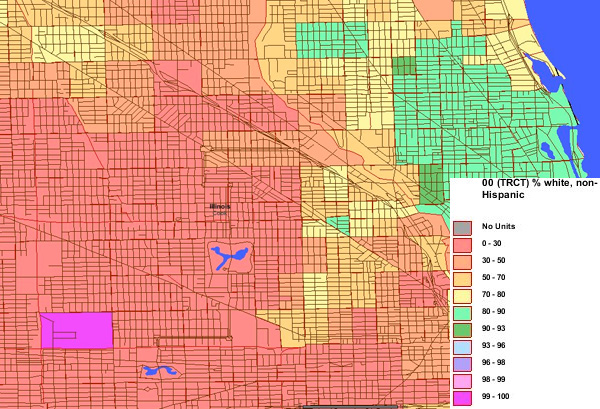
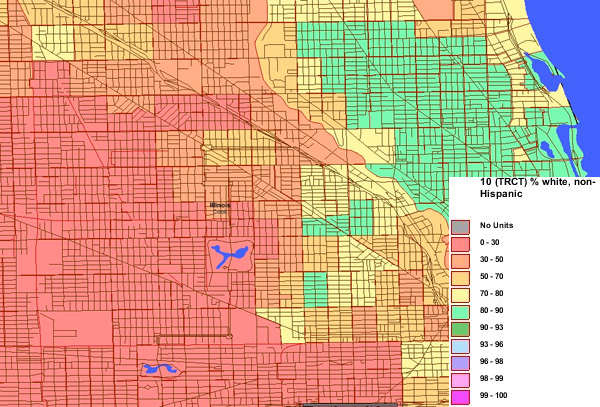
Now, from the most recent Census, the tract containing the square itself is white-majority; surrounding tracts to the west, south, and southeast are around the threshold. Humboldt Park remains below it, as it has been for the past three decades:
It's worth keeping in mind that Hwang and Sampson are looking at gentrification within a particular moment in time—one with a particular economic history, changing beliefs about the city and urbanism, changing government interventions, immigration patterns, and so forth. A threshold of 35 percent is not a law of nature; it may not reflect the future of urban development and redevelopment, near and distant.
It's more signifcant for its power in looking backwards. What can look random and rapid, like the proliferation of cocktail bars and boites in Logan Square next to a neighborhood that's described as "long… under-developed but has begun to see signs of gentrification," can actually have its roots in subtle variations in history long past.


