Best Public High Schools
Our first rankings in five years go deeper than ever, with 110 schools across the six-county metro area.
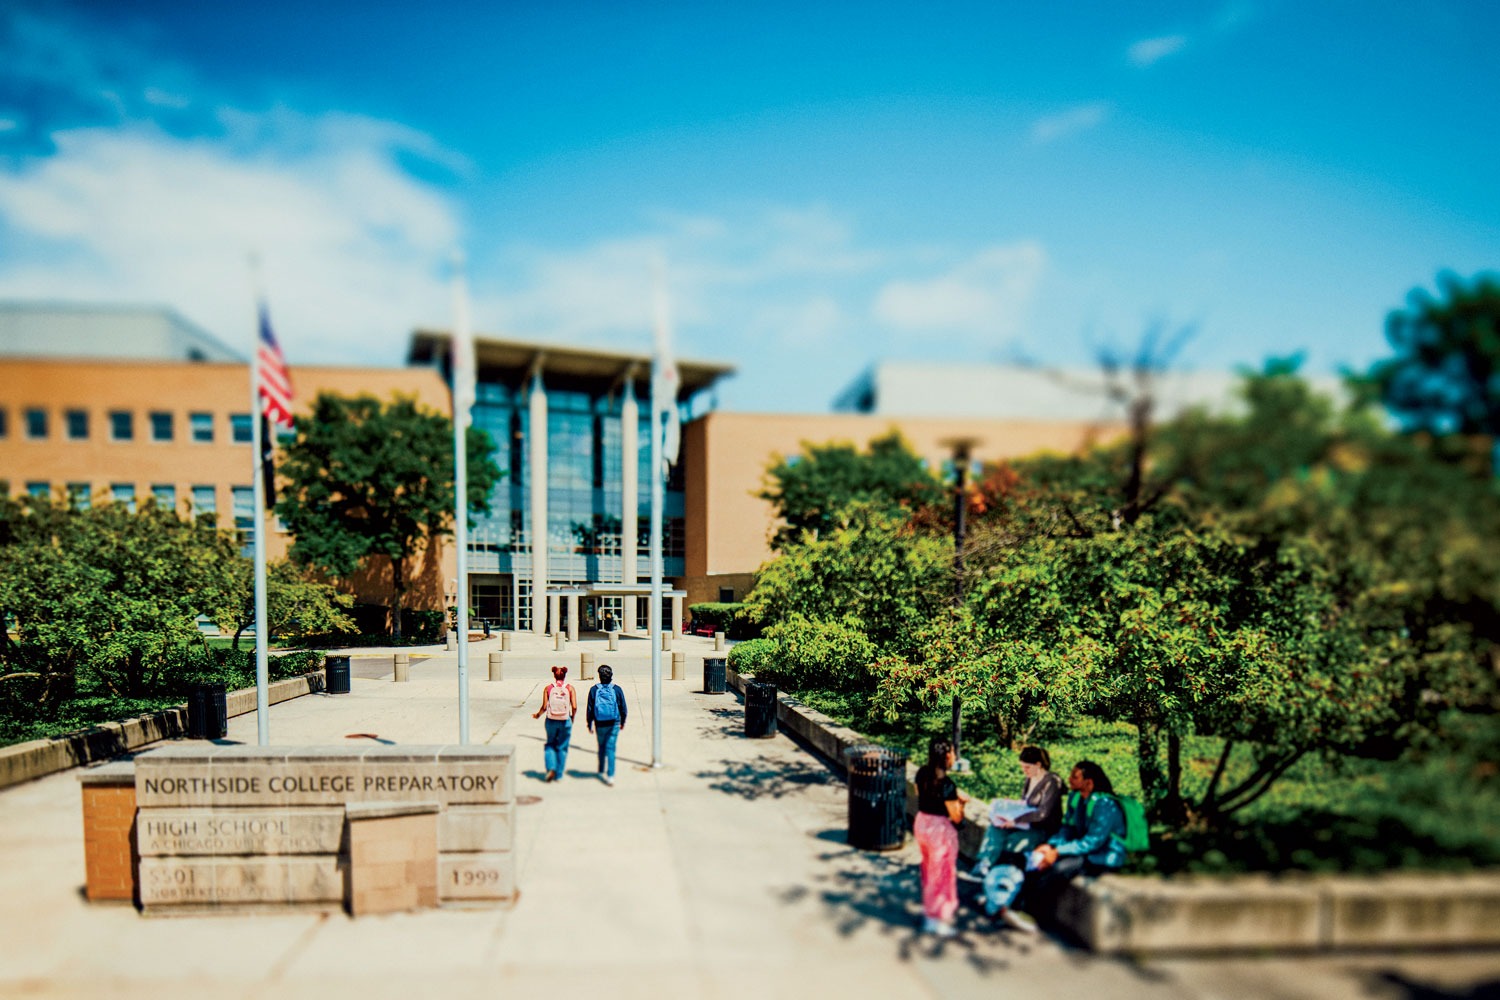
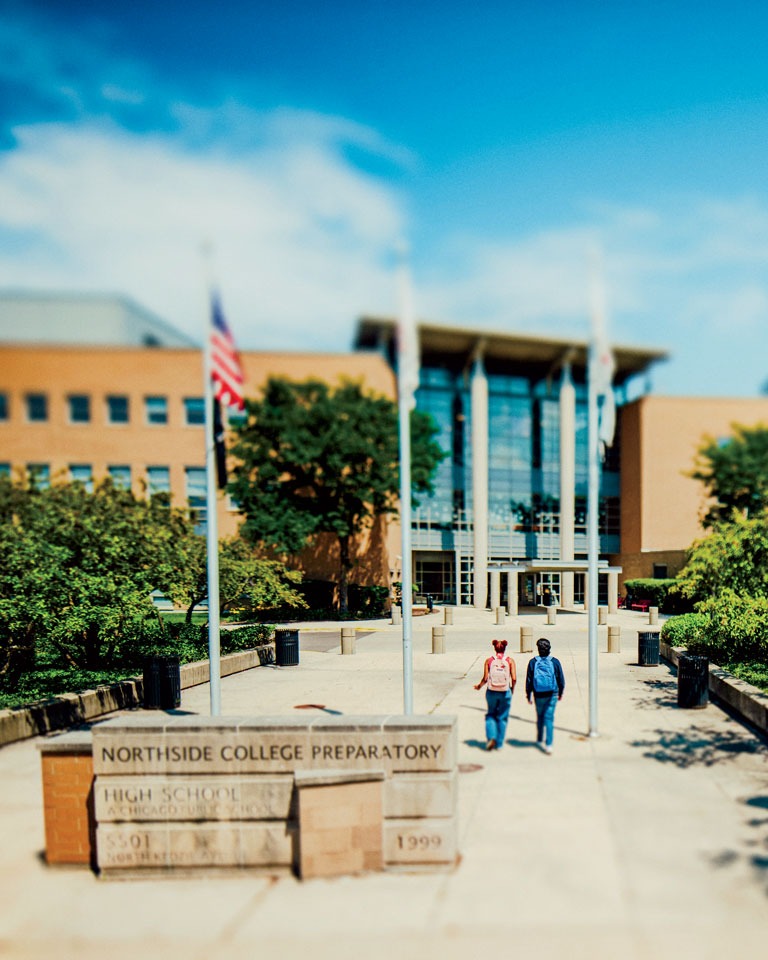
Top Chicago Schools
| Enrollment | SAT reading attainment % | SAT math attainment % | 5Essentials | Graduation rate | |||
|---|---|---|---|---|---|---|---|
| 1 | Northside College Preparatory High School (S) | North Park | 1,040 | 93 | 94 | 85 | 97 |
| 2 | Whitney M. Young Magnet High School (S) | Near West Side | 2,146 | 90 | 91 | 80 | 95 |
| 3 | Albert G. Lane Technical High School (S) | Lake View | 4,482 | 90 | 88 | 65 | 96 |
| 4 | William Jones College Preparatory High School (S) | Printers Row | 1,930 | 92 | 87 | 51 | 94 |
| 5 | Walter Payton College Preparatory High School (S) | Near North Side | 1,231 | 88 | 86 | 85 | 96 |
| 6 | Gwendolyn Brooks College Preparatory Academy (S) | Roseland | 971 | 64 | 61 | 72 | 94 |
| 7 | John Hancock College Preparatory High School (S) | Clearing | 1,003 | 52 | 50 | 66 | 98 |
| 8 | Horizon Science Academy McKinley Park (C) | McKinley Park | 866 | 38 | 29 | 36 | 90 |
| 9 | George Westinghouse College Prep (S) | Humboldt Park | 1,195 | 38 | 28 | 67 | 94 |
| 10 | Back of the Yards College Preparatory High School | Back of the Yards | 1,003 | 19 | 24 | 59 | 94 |
| 11 | Chicago Math and Science Academy (C) | Rogers Park | 602 | 18 | 25 | 55 | 87 |
| 12 | Eric Solorio Academy | Gage Park | 1,224 | 16 | 17 | 63 | 88 |
| 13 | DeVry University Advantage Academy | Ravenswood | 134 | 37 | 30 | 63 | 98 |
| 14 | Infinity Math, Science & Technology High School | Little Village | 409 | 17 | 16 | 53 | 88 |
| 15 | Noble–Pritzker College Prep (C) | Hermosa | 955 | 17 | 10 | 47 | 98 |
| 16 | Friedrich W. Von Steuben Metropolitan Science HS | North Park | 1,643 | 40 | 33 | 51 | 93 |
| 17 | Phoenix Military Academy | Near West Side | 459 | 12 | 10 | 60 | 96 |
| 18 | Intrinsic Schools Downtown Campus (C) | Loop | 628 | 18 | 9 | 39 | 94 |
| 19 | Noble–Mansueto High School (C) | Brighton Park | 1,038 | 15 | 13 | 57 | 95 |
| 20 | Noble–Noble Street College Prep (C) | Noble Square | 659 | 17 | 18 | 71 | 94 |
| 21 | Noble–ITW David Speer Academy (C) | Hanson Park | 1,101 | 13 | 12 | 49 | 94 |
| 22 | Intrinsic Schools Belmont Campus (C) | Kilbourn Park | 983 | 14 | 12 | 65 | 90 |
| 23 | Lincoln Park High School | Lincoln Park | 2,072 | 53 | 51 | 39 | 89 |
| 24 | Marine Leadership Academy at Ames | Logan Square | 697 | 15 | 10 | 51 | 94 |
| 25 | Chicago Academy High School | Portage Park | 556 | 18 | 15 | 59 | 97 |
| 26 | Daniel Hale Williams Prep School of Medicine | Bronzeville | 72 | 6 | 6 | 62 | 100 |
| 27 | Robert Lindbolm Math and Science Academy (S) | West Englewood | 1,396 | 47 | 33 | 55 | 91 |
| 28 | Kenwood Academy | Kenwood | 2,311 | 33 | 23 | 78 | 92 |
| 29 | Noble–Chicago Bulls College Prep (C) | Near West Side | 1,167 | 9 | 11 | 62 | 94 |
| 30 | Charles Allen Prosser Career Academy | Hanson Park | 1,163 | 16 | 9 | 57 | 90 |
| 31 | Catalyst–Maria Charter School (C) | Marquette Park | 1,089 | 6 | 0 | 70 | 79 |
| 32 | Dr. Martin Luther King Jr. College Preparatory HS (S) | North Kenwood | 581 | 21 | 8 | 56 | 90 |
| 33 | Ogden International High School | West Town | 490 | 23 | 21 | 65 | 91 |
| 34 | Horizon Science Academy Southwest Chicago (C) | Gage Park | 743 | 17 | 6 | 46 | 92 |
| 35 | Noble–UIC College Prep (C) | Near West Side | 899 | 14 | 9 | 40 | 91 |
| 36 | Noble–Muchin College Prep (C) | Loop | 842 | 15 | 11 | 49 | 96 |
| 37 | Noble–Golder College Prep (C) | West Town | 636 | 12 | 4 | 52 | 84 |
| 38 | Aspira Early College High School (C) | Logan Square | 261 | 4 | 4 | 67 | 81 |
| 39 | Gurdon S. Hubbard High School | West Lawn | 1,713 | 10 | 6 | 59 | 81 |
| 40 | Roald Amundsen High School | Ravenswood | 1,494 | 35 | 31 | 65 | 91 |
| 41 | Noble–Rauner College Prep (C) | West Town | 659 | 9 | 12 | 65 | 90 |
| 42 | CICS–Northtown Academy (C) | Pulaski Park | 886 | 15 | 9 | 59 | 93 |
| 43 | Hyman G. Rickover Naval Academy | Portage Park | 459 | 19 | 15 | 62 | 89 |
| 44 | Disney II Magnet School | Irving Park | 752 | 30 | 13 | 67 | 90 |
| 45 | Acero–Sor Juana Inés de la Cruz Campus (C) | West Rogers Park | 513 | 5 | 3 | 36 | 92 |
| 46 | Chicago Technology Academy | University Village | 378 | 2 | 0 | 53 | 87 |
| 47 | Acero–Major Hector P. Garcia MD Campus (C) | Archer Heights | 638 | 5 | 5 | 56 | 96 |
| 48 | World Language High School | Little Village | 344 | 13 | 6 | 42 | 83 |
| 49 | North-Grand High School | Hermosa | 1,063 | 3 | 3 | 60 | 84 |
| 50 | Chicago Collegiate Charter School (C) | Pullman | 251 | 4 | 0 | 47 | 89 |
How We Ranked the Schools
The performance measures were based on data obtained from the Illinois State Board of Education for the 2022–23 school year, the most recent available. Calculations were done by the research nonprofit RTI International, based on weighting instructions provided by Chicago. Note that not all the measures used appear in the rankings tables.
The Measures We Used
- SAT attainment rate is the percentage of students meeting or exceeding state standards on the SAT reading and math exams. Separately factored in: SAT attainment figures adjusted for the school’s percentage of low-income students. Income-adjusted figures are widely used to evaluate how a school’s performance compares with predicted levels.
- 5Essentials is a teacher and student survey that assesses five key aspects of a school’s learning environment. Figures shown in the rankings tables are the average scores for all five rubrics.
- Attendance is a school’s average daily rate, an indicator of the learning environment.
- Graduation rate is the percentage of students who graduated within four years of entering high school.
How We Weighted the Measures
- SAT reading attainment rate: 12.5%
- SAT math attainment rate: 12.5%
- SAT reading attainment rate, income-adjusted: 12.5%
- SAT math attainment rate, income-adjusted: 12.5%
- 5Essentials: 15%
- Attendance: 15%
- Graduation rate: 20%