Best Public High Schools
Our first rankings in five years go deeper than ever, with 110 schools across the six-county metro area.
Top Suburban Cook County Schools
| Enrollment | Spending per pupil | SAT reading attainment % | SAT math attainment % | Graduation rate | |||
|---|---|---|---|---|---|---|---|
| 1 | New Trier Township High School | Winnetka/Northfield | 3,736 | $19,083 | 80 | 71 | 97 |
| 2 | Glenbrook North High School | Northbrook | 2,026 | $15,041 | 75 | 75 | 97 |
| 3 | John Hersey High School | Arlington Heights | 2,018 | $14,101 | 67 | 61 | 96 |
| 4 | William Fremd High School | Palatine | 2,632 | $13,750 | 63 | 64 | 94 |
| 5 | Glenbrook South High School | Glenview | 2,977 | $15,041 | 61 | 59 | 96 |
| 6 | James B. Conant High School | Hoffman Estates | 2,449 | $13,750 | 54 | 57 | 97 |
| 7 | Oak Park and River Forest High School | Oak Park | 3,259 | $13,930 | 61 | 50 | 95 |
| 8 | Prospect High School | Mount Prospect | 2,188 | $14,101 | 58 | 52 | 94 |
| 9 | Evanston Township High School | Evanston | 3,579 | $14,373 | 53 | 44 | 93 |
| 10 | Maine South High School | Park Ridge | 2,459 | $15,826 | 56 | 50 | 95 |
| 11 | Lyons Township High School | La Grange/Western Springs | 3,787 | $13,039 | 55 | 54 | 96 |
| 12 | Schaumburg High School | Schaumburg | 2,274 | $13,750 | 42 | 50 | 92 |
| 13 | Niles North High School | Skokie | 1,948 | $17,594 | 44 | 41 | 91 |
| 14 | Lemont High School | Lemont | 1,317 | $11,735 | 54 | 48 | 96 |
| 15 | Niles West High School | Skokie | 2,524 | $17,594 | 42 | 35 | 92 |
| 16 | Hoffman Estates High School | Hoffman Estates | 2,015 | $13,750 | 36 | 37 | 92 |
| 17 | Buffalo Grove High School | Buffalo Grove | 1,855 | $14,101 | 43 | 44 | 91 |
| 18 | Riverside Brookfield High School | Riverside | 1,647 | $11,766 | 49 | 45 | 94 |
| 19 | Rolling Meadows High School | Rolling Meadows | 1,908 | $14,101 | 38 | 35 | 92 |
| 20 | Carl Sandburg High School | Orland Park | 2,839 | $11,454 | 43 | 37 | 93 |
| 21 | Palatine High School | Palatine | 2,608 | $13,750 | 27 | 27 | 90 |
| 22 | Amos Alonzo Stagg High School | Palos Hills | 2,499 | $11,454 | 38 | 36 | 90 |
| 23 | Proviso Mathematics & Science Academy | Forest Park | 899 | $9,654 | 50 | 38 | 96 |
| 24 | Maine East High School | Park Ridge | 1,816 | $15,826 | 30 | 23 | 89 |
| 25 | Victor J. Andrew High School | Tinley Park | 2,257 | $11,454 | 36 | 26 | 94 |
Top DuPage County Schools
| Enrollment | Spending per pupil | SAT reading attainment % | SAT math attainment % | Graduation rate | |||
|---|---|---|---|---|---|---|---|
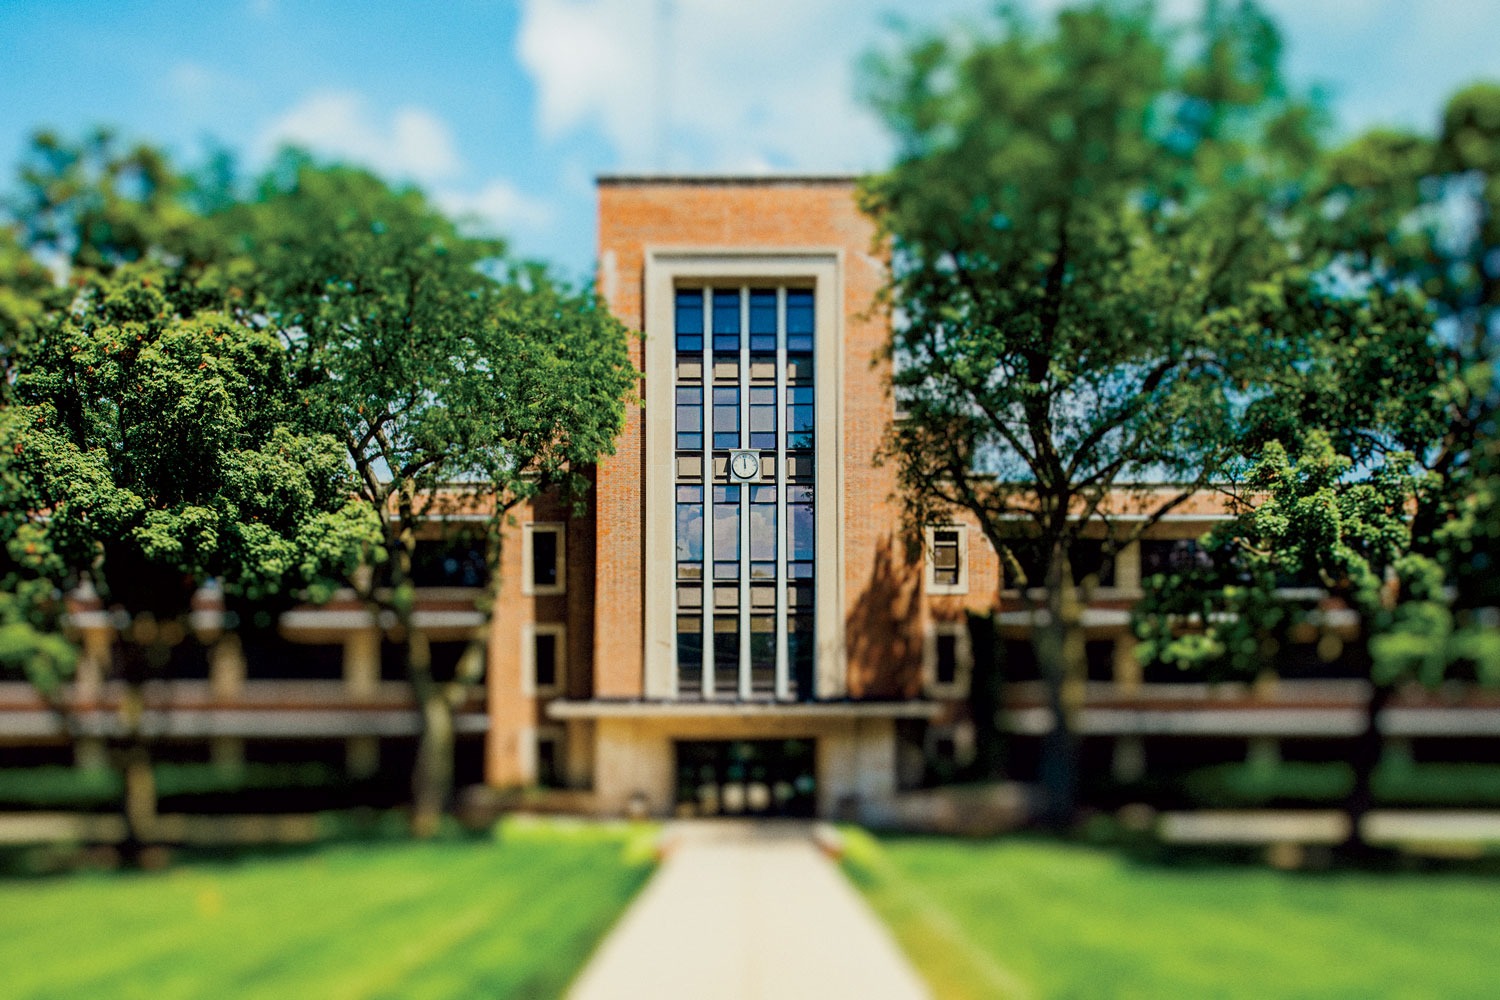
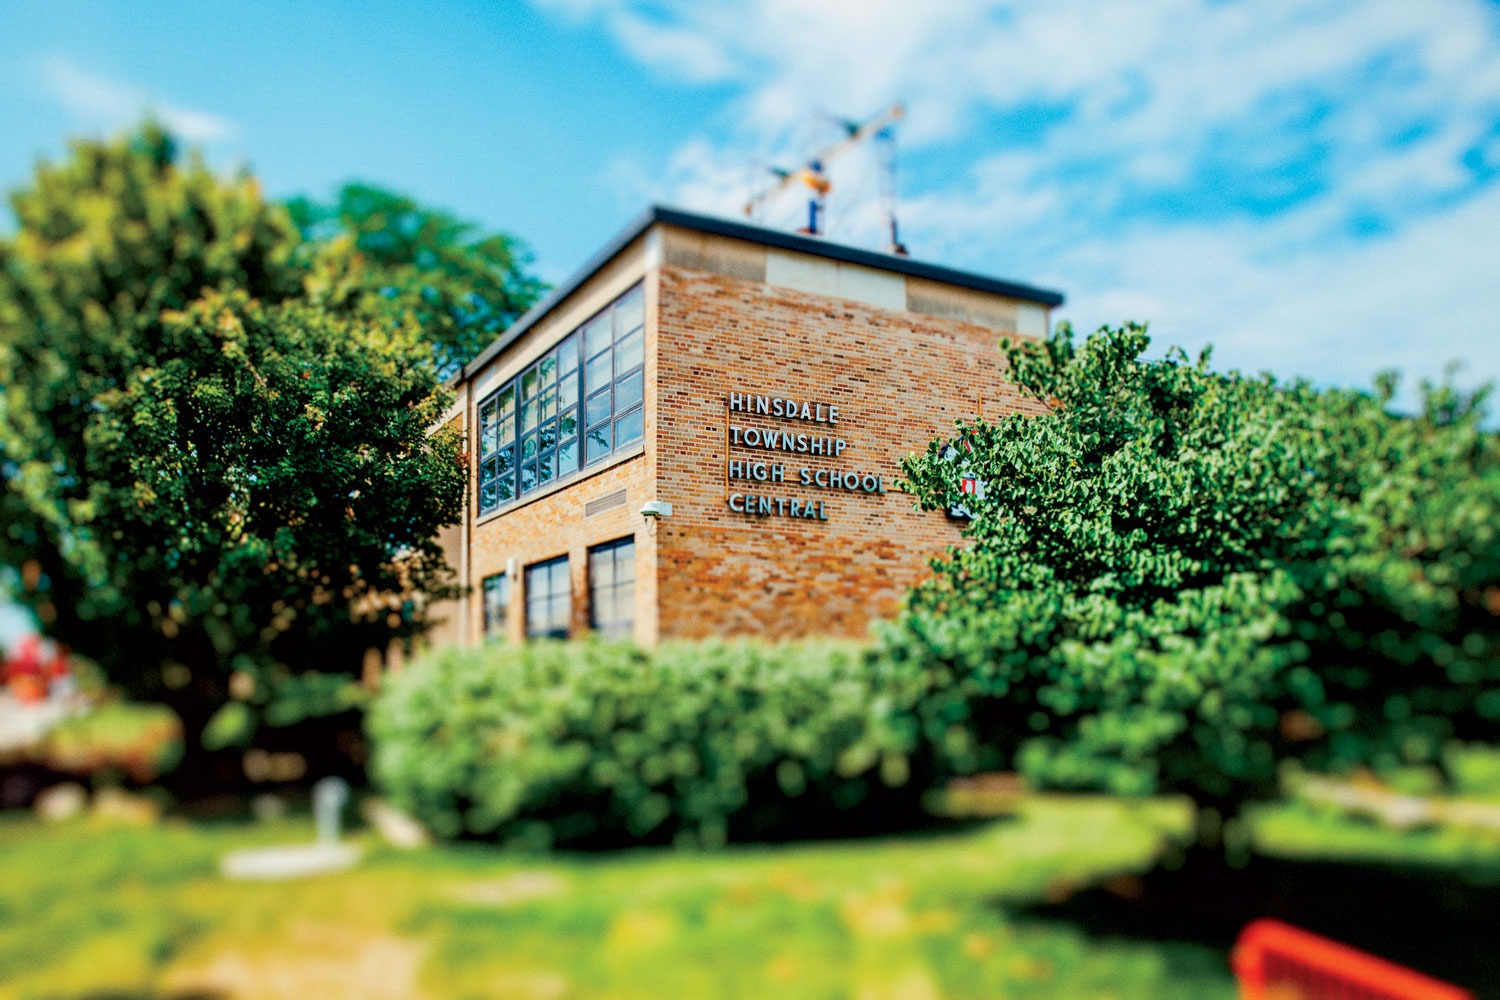
| 1 | Hinsdale Central High School | Hinsdale | 2,419 | $16,153 | 76 | 70 | 96 |
| 2 | Westmont High School | Westmont | 372 | $14,257 | 56 | 55 | 96 |
| 3 | Lisle High School | Lisle | 407 | $14,456 | 51 | 48 | 94 |
| 4 | Naperville Central High School | Naperville | 2,511 | $11,227 | 62 | 57 | 97 |
| 5 | Glenbard West High School | Glen Ellyn | 2,298 | $13,167 | 53 | 52 | 94 |
| 6 | Naperville North High School | Naperville | 2,526 | $11,227 | 60 | 52 | 95 |
| 7 | Wheaton North High School | Wheaton | 1,838 | $10,726 | 52 | 46 | 96 |
| 8 | Glenbard South High School | Glen Ellyn | 1,081 | $13,167 | 47 | 47 | 94 |
| 9 | Wheaton Warrenville South High School | Wheaton | 1,802 | $10,726 | 45 | 41 | 95 |
| 10 | Downers Grove North High School | Downers Grove | 2,105 | $14,383 | 52 | 49 | 94 |
Top Lake County Schools
| Enrollment | Spending per pupil | SAT reading attainment % | SAT math attainment % | Graduation rate | |||
|---|---|---|---|---|---|---|---|
| 1 | Lake Forest High School | Lake Forest | 1,429 | $19,367 | 64 | 62 | 98 |
| 2 | Deerfield High School | Deerfield | 1,454 | $19,902 | 71 | 67 | 96 |
| 3 | Adlai E. Stevenson High School | Lincolnshire | 4,431 | $13,903 | 72 | 73 | 95 |
| 4 | Vernon Hills High School | Vernon Hills | 1,467 | $16,802 | 60 | 62 | 96 |
| 5 | Libertyville High School | Libertyville | 1,767 | $16,802 | 68 | 58 | 95 |
| 6 | Highland Park High School | Highland Park | 1,691 | $19,902 | 56 | 50 | 95 |
| 7 | Barrington High School | Barrington | 2,765 | $12,026 | 57 | 56 | 95 |
| 8 | Lake Zurich High School | Lake Zurich | 1,782 | $9,960 | 58 | 56 | 96 |
| 9 | Grayslake Central High School | Grayslake | 1,372 | $13,383 | 48 | 29 | 97 |
| 10 | Warren Township High School | Gurnee | 3,608 | $11,279 | 34 | 29 | 95 |
Top Kane County Schools
| Enrollment | Spending per pupil | SAT reading attainment % | SAT math attainment % | Graduation rate | |||
|---|---|---|---|---|---|---|---|
| 1 | Geneva Community High School | Geneva | 1,613 | $10,017 | 60 | 47 | 97 |
| 2 | St. Charles North High School | St. Charles | 1,835 | $10,835 | 50 | 52 | 93 |
| 3 | Batavia High School | Batavia | 1,768 | $10,321 | 48 | 42 | 95 |
| 4 | St. Charles East High School | St. Charles | 1,982 | $10,835 | 45 | 44 | 91 |
| 5 | Dundee-Crown High School | Carpentersville | 2,470 | $8,965 | 21 | 14 | 95 |
Top McHenry County Schools
| Enrollment | Spending per pupil | SAT reading attainment % | SAT math attainment % | Graduation rate | |||
|---|---|---|---|---|---|---|---|
| 1 | Cary-Grove High School | Cary | 1,444 | $11,612 | 46 | 40 | 96 |
| 2 | Prairie Ridge High School | Crystal Lake | 1,151 | $11,612 | 46 | 41 | 95 |
| 3 | Richmond-Burton Community High School | Richmond | 546 | $12,730 | 40 | 43 | 98 |
| 4 | Harry D. Jacobs High School | Algonquin | 2,080 | $8,965 | 44 | 35 | 97 |
| 5 | Crystal Lake Central High School | Crystal Lake | 1,446 | $11,612 | 36 | 31 | 96 |
Top Will County Schools
| Enrollment | Spending per pupil | SAT reading attainment % | SAT math attainment % | Graduation rate | |||
|---|---|---|---|---|---|---|---|
| 1 | Neuqua Valley High School | Naperville | 3,199 | $9,464 | 67 | 66 | 96 |
| 2 | Lincoln-Way East High School | Frankfort | 2,727 | $8,934 | 57 | 55 | 95 |
| 3 | Lincoln-Way Central High School | New Lenox | 1,941 | $8,934 | 56 | 50 | 96 |
| 4 | Lincoln-Way West High School | New Lenox | 1,948 | $8,934 | 52 | 46 | 99 |
| 5 | Lockport Township High School | Lockport | 3,834 | $9,733 | 35 | 35 | 93 |
How We Ranked the Schools
The performance measures were based on data obtained from the Illinois State Board of Education for the 2022–23 school year, the most recent available. Calculations were done by the research nonprofit RTI International, based on weighting instructions provided by Chicago. Note that not all the measures used appear in the rankings tables.
The Measures We Used
- Spending per pupil is the instructional expenditure reported by the district.
- SAT attainment rate is the percentage of students meeting or exceeding state standards on the SAT reading and math exams. Separately factored in: SAT attainment figures adjusted for the school’s percentage of low-income students. Income-adjusted figures are widely used to evaluate how a school’s performance compares with predicted levels.
- Attendance is a school’s average daily rate, an indicator of the learning environment.
- Graduation rate is the percentage of students who graduated within four years of entering high school.
How We Weighted the Measures
- SAT reading attainment rate: 12.5%
- SAT math attainment rate: 12.5%
- SAT reading attainment rate, income-adjusted: 12.5%
- SAT math attainment rate, income-adjusted: 12.5%
- Instructional spending per pupil: 15%
- Attendance: 15%
- Graduation rate: 20%


