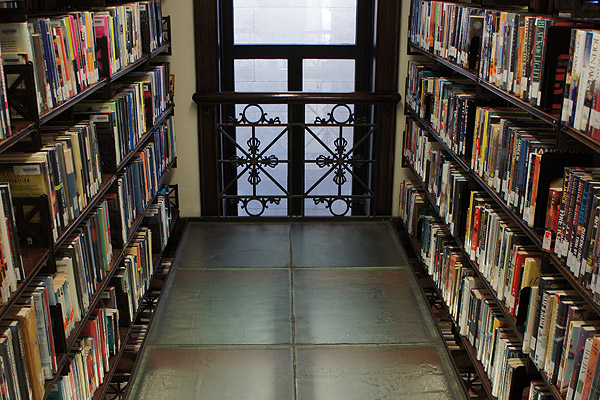
Blackstone Library in Kenwood, my favorite in the city.
As a heavy Chicago Public Libraries user, I've been wanting to do maps like this for awhile. Below are two, which show average monthly circulation and computer sessions for all existing CPL locations, from January 2011 through May 2012; this data is laid on top of the Chicago Public Schools' socioeconomic tiers (source and explanation). Not all the libraries have been in use for all 17 months—the Richard M. Daley and Little Village libraries are new, for example, while Edgewater and Humboldt Park have been under renovation for some of that time.
I think there's some modest expected correlation—lower-income areas tend to have higher computer-session usage, higher-income areas tend to have higher circulation.
One number not in the map: e-books and downloadable media. On average, e-circulation accounts for 18,970 items a month, higher than all but two libraries (Harold Washington, at 80,420, and Sulzer Regional, at 51,641). But that's been steadily increasing, from 13,841 in January 2011 to 26,283 in May 2012.
Average Monthy Circulation

Average Monthly Computer Sessions


